From Evapotron to Assimitron: or how to measure CO2 in a canopy
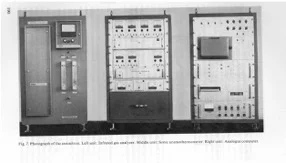
At the Australian CSIRO’s Division of Meteorological Physics outside Melbourne, two researchers answered “the need” for a device to measure evaporation from natural surfaces by designing what they initially called an “evaporimeter” in their original 1958 paper in Nature but which evolved into the “Evapotron” by 1965.[1] The Evapotron, later researchers in Japan explained, “instantaneously” performed “the necessary calculations for determining water vapour flux by correlation of humidity fluctuations with vertical wind fluctuations.” Subsequently, the Japanese team led by E. Inoue at the National Institute of Agricultural Sciences adopted the principles of Australian instrument and applied them to the problem of measuring CO2 fluxes in crop canopies, an often turbulent boundary layer. They developed an “Assimitron,” which directly “referred to the name “Evapotron” devised by Australian scientists.”[2] Like all biological trons, the Evapotron and the Assimitron defined and measured multiple features of the environment in quantifiable and computable terms. The Assimitron “determine[d] the CO2 flux, corresponding to the net CO2 assimilation or respiration of crop plants.” Like earlier phytotrons, both the Evapotron and the Assimitron united existing technologies with computers to handle the enormous quantity of data generated. Among its important features were two independent calculations to deal directly with the complex nature of turbulent flow in contrast to the simple linear flow at low velocities and temperatures. This served, the Japanese insisted, “to improve the accuracy of results.”[3]
As Uchijima described, the Assimitron comprised an “sonic anemothermometer for measuring the momentum and heat fluxes,” a “gas analyzer for determining the difference in CO2 concentration between two heights,” and a “computing unit.” It was “completely transistorized, mobile and simple to operate in the field.” According to Uchijima, the “vertical turbulent flux of CO2 in the surface air layer” was calculated using the measurements from the anemothermometers and air sampling nozzles via equations comprised of the turbulent fluxes of momentum, sensible heat and the difference in wind speed and air temperature between heights z1 and z2, at which the CO2 concentrations C1 and C2 are taken. Moreover, Uchijima explained why the Japanese device used two equations. It was because the upper equation was “expected to give accurate results on windy days when mechanical turbulence is predominant,” while the lower equation was to be “used on sunny days when thermal turbulence becomes predominant.”
In short, the study of photosynthesis was somewhere between fluid dynamics and thermodynamics.
[1]. R.J. Taylor & A.J. Dyer, An Instrument for Measuring Evaporation from Natural Surfaces, Nature 181 (Feb 8, 1958): 408-409. Taylor and Dyer refer to their “evaporimeter” in figure 1, showing the configuration of an anemometer and hygrometer joined to an analogue multiplier, on p. 408. The term “evapotron” is used by the Japanese group in E. Inoue, Z. Uchijima, T. Saito, S. Isobe, and K. Uemura, ‘The “Assimitron”, a Newly Devised Instrument for Measuring CO2 flux in the Surface Air Layer,’ Journal of Agricultural Meteorology, Tokyo 25 (1969): 165-171, 165. See also A.J. Dyer & F.J. Maher, ‘Automatic Eddy-Flux Measurement with the Evapotron,’ Journal of Applied Meteorology 4 (1965): 622-625.
[2]. E. Inoue, ‘The “Assimitron”,’ 165.
[3]. Z. Uchijima, “Carbon dioxide environment and flux within a corn crop canopy,” in Prediction and Measurement of Photosynthetic Productivity (Wageningen: Centre for Agricultural Publishing and Documentation, 1970): 179-196, 188.


